Global Ocean Freight Trends 2025: Cost Structure, Risks, and Cost-Saving Strategies for Fertilizer Exports
I. 2025 Ocean Freight Market Overview: High Rates Coexist with Structural Tightness
As of 2025, the global ocean freight market is characterized by high volatility, pronounced regional disparities, and heightened supply chain uncertainty, significantly impacting CIF quotations for fertilizer products (CAN, calcium nitrate, magnesium nitrate, and water-soluble NPK fertilizers).
Three Core Trends in the 2025 Ocean Freight Market:
Trend 1|Structural Rate Increases on Key Asia-Originating Routes
These include:
- China → Europe
- China → East Africa (Kenya, Tanzania)
- China → Middle East via the Red Sea
- China → West Coast of Latin America
These routes began showing signs of tightness in Q4 2025 and are expected to remain constrained into 2026.
Trend 2|Declining Container Turnaround Efficiency
Driven by the following factors:
- Vessel blank sailings and rerouting
- Port congestion
- Imbalanced equipment distribution
This directly leads to: limited vessel space → rising freight rates.
Trend 3|Rising Export Costs for Dangerous Goods (DG) and Bulk Fertilizers
Certain fertilizer products (e.g., ammonium nitrate-based) are classified as DG during transport, incurring additional fees:
- DG surcharge (DGA)
- Port security surcharge
- Space restrictions requiring earlier booking
II. Breakdown of Ocean Freight Costs: Key Factors Affecting Fertilizer CIF Pricing
Ocean freight costs influencing fertilizer export quotations typically consist of the following components:
1. Base Ocean Freight
Accounts for 40–70% of the CIF price (varies by destination).
2. Surcharges
Includes:
- BAF (Bunker Adjustment Factor – fuel surcharge)
- CAF (Currency Adjustment Factor)
- PSS (Peak Season Surcharge)
- DGA (Dangerous Goods Surcharge)
- CIC (Container Imbalance Charge)
3. Port Charges
Vary significantly by country; for example, port handling fees in East Africa remain notably high.
4. Customs Clearance and Destination Port Charges
These are combined with CIF costs to determine the importer’s actual landed cost.
III. Key Route Freight Trends: Which Routes Pose the Highest Risk in 2025?
The following routes will have the greatest impact on fertilizer export pricing in 2025:
1. China → Europe Route (Persistently High Rates)
Causes:
- Congestion at European ports (Rotterdam, Hamburg)
- Equipment shortages
- Red Sea diversions extending average voyage duration
Projected 2025 rate increase: 8–15%
Impact:
High-value, high-density goods (e.g., CN, MN) are less affected
Low-density products (e.g., water-soluble NPK) are most impacted
2. China → East Africa Route (Highest Volatility)
Ports:
- Mombasa (Kenya)
- Dar es Salaam (Tanzania)
Causes:
- Unstable sailing schedules
- High proportion of DGA fees
- Low port efficiency
Expected volatility range: 15–30%
This is the most challenging route for all fertilizer exporters.
3. China → Middle East Route (Most Affected by Red Sea Disruptions)
Ongoing Red Sea tensions continue to force vessel rerouting, extending transit times.
Freight rates projected to rise by 10–20%
This significantly impacts fertilizer import costs for markets like the UAE and Saudi Arabia.
4. China → West Coast of Latin America Route (Long-Haul, High-Cost)
Ports:
- Callao (Peru)
- San Antonio (Chile)
Expected volatility: 10–18%
International fertilizer traders must remain highly vigilant.
IV. Impact of Rising Freight Rates on Fertilizer Prices: Which Products Are Most Affected?
In the CIF cost structure of fertilizers, the higher the transportation cost share, the more price-sensitive the product.
Most Affected (Low-Density Products)
- Macronutrient water-soluble fertilizers (NPK)
- Micronutrient water-soluble fertilizers
- Bulk low-density cargo in large packaging
Moderately Affected
- CAN (Calcium Ammonium Nitrate)
- Calcium Nitrate (CN)
Least Affected (High-Density Products)
- Magnesium Nitrate (MN)
- Industrial-grade nitrates
V. 2025 Ocean Freight Risk Alert: Key Factors Likely to Trigger Sharp Price Swings
Risk 1|Geopolitical Tensions and Route Diversions
Especially on Red Sea routes—rerouting can increase freight costs by 20–40%.
Risk 2|Rising Fuel Prices
Fluctuations in BAF directly affect ocean freight costs.
Risk 3|Space Shortages (Peak Season + Export Concentration)
Manifested as:
- Carrier-imposed cargo limits
- Restrictions on DG cargo
- Booking required 2–4 weeks in advance
Risk 4|Port Congestion and Delays
Most evident on East African routes.
VI. Cost-Saving Strategies for Importers: 7 Actionable Recommendations
Strategy 1|Select the Optimal Chinese Export Port
Significant rate differences exist among ports:
Qingdao, Tianjin, Lianyungang → Ideal for Europe and the Middle East
Shanghai, Ningbo → Best for Southeast Asia
Guangzhou, Shenzhen → Preferred for Africa and South America
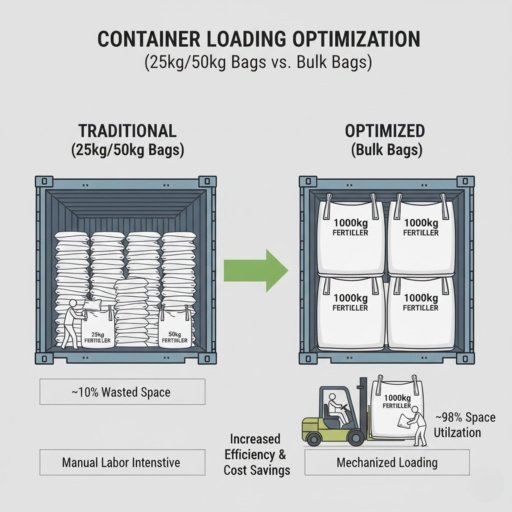
Strategy 2|Use High-Density Packaging (25kg or 50kg Bags)
Increases cargo density per container, reducing freight cost as a percentage of total price.
Strategy 3|Optimize Container Loading
- 27 MT full load (suitable for nitrate-based products)
- 24–25 MT (suitable for water-soluble fertilizers)
Strategy 4|Diversify Bookings to Mitigate Single-Route Risk
Strategy 5|Lock in Rates via Long-Term Contracts (Contract Rate)
Recommended for importers with annual purchases exceeding 300 MT.
Strategy 6|Combine FOB Quotations with Independent Freight Forwarder Comparisons
Highly recommended for large trading companies.
Strategy 7|Partner with Suppliers with Multi-Plant Resources (e.g., Hansol)
Avoids delays caused by disruptions at a single production site.
VII. 2025 Marks the Dawn of the “Supply Chain Competition” Era in Fertilizer Trade
Global ocean freight rates in 2025 will continue to reshape fertilizer trade pricing structures and delivery capabilities.
In this highly volatile environment, importers must possess:
- Better supply chain foresight
- More flexible booking strategies
- A more resilient supplier network
Leveraging its multi-plant supply chain in China, long-term logistics partnerships, and DG-compliant export capabilities,
Hansol Chemical delivers global customers an international logistics solution featuring stable supply + controllable costs + predictable delivery.